
Why Could Positive Stock-Bond Correlation Stay For Longer?
Correlation between US stocks and bonds turned positive almost two years ago. Here is why it could remain positive, and what the implications are.

The phenomenon of positive correlation between US stocks and bonds might be a new one for some investors because the negative relation was visible basically since 2000. This period abounded with heightened central bank activity. Nevertheless, the trend broke down two years ago, and correlation has been rising ever since. In entails a lot of important consequences for asset managers as bonds basically lost their hedging feature1. It also affects the way a portfolio should be constructed so as to obtain the efficient mix of assets. In this post I’m gonna explain what could have pushed correlation above the neutral mark, why this coefficient might stay there, and what the consequences for asset managers could be. Let’s dive in.
Regime change takes time
There is no doubt that it can take a long time to recognise a regime change before it is incorporated into portfolio construction considerations. This may simply be due to the fact that we often work with averages to smooth different time series and thus remove noise. However, this approach has a cost in the form of a blurring of the current situation, either in the markets or in real economic data.
The chart below, representing the 3-year rolling correlation of monthly returns, is a good example of it. Put it simply, it’s always a trade-off between the amount of noise the user is willing to accept, and the time when the user wants to get a message that something is going on. To be precise, the chart takes into account returns from the SPX as well as the Bloomberg US Treasury Index which, excludes Treasury bills.
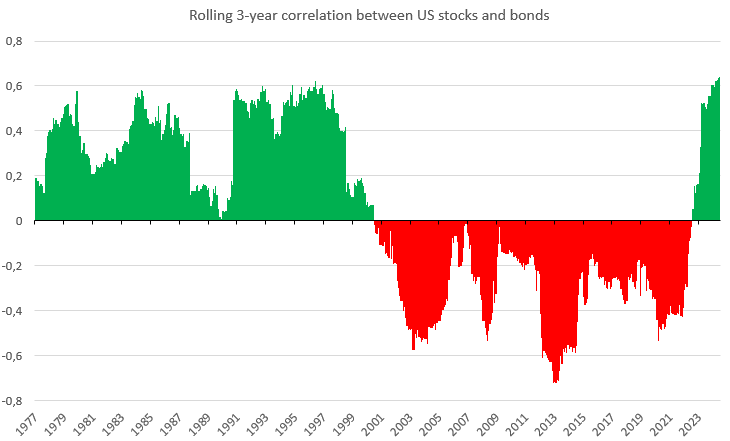
The pivotal question here is why correlation actually turned positive two years ago? First of all, one needs to be aware of the fact that stock-bond correlation seems to be positively related to real rates. Thus, the higher real bond yields, the higher correlation between stock and bond returns. And it held true in the past, when US real yields tanked at the beginning of 2000s. On top of that, higher real yields often come hand in hand with higher inflation and heightened uncertainty associated to real rates per se (higher inflation levels usually entails a higher degree of uncertainty where inflation could be in the future).
It was basically the case a few years ago, when inflation soared and global central banks embarked on a sizzling rate hike cycle. Thus, real yields were higher, inflation was higher, and inflation volatility was higher as well. In the aftermath of these events, correlation between stocks and bonds also turned positive. The major result of the positive bond-stock correlation is the fact that investors demand some premium when investing in bonds when fixed income assets lose their hedging capability.
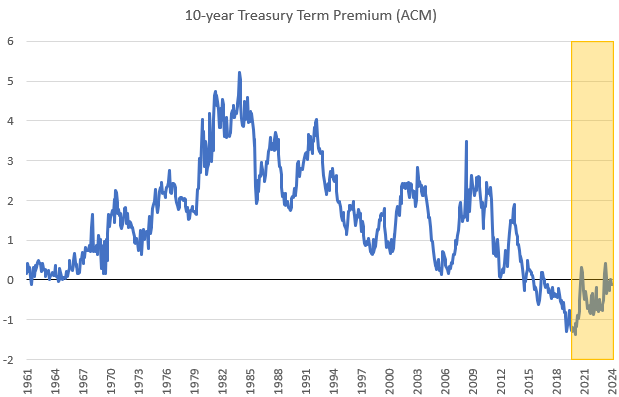
As a result, we should see a rising bond premium (aka term premium), which took place a few years ago. I need to admit here that I don’t know what a rise we ought to expect, but the sheer change of direction is thought-provoking.
Is term premium going to rise?
We have already seen that the recent rise in correlation between equities and bonds has been accompanied by a corresponding move in the term premium. The question is whether the premium is likely to continue climbing?
In this respect, it’s worth returning to the last year’s Treasury presentation to TBAC2. The main point there is the fact that higher bond issuance is among the factors fueling the higher term premium. In other words, US fiscal policy has recently become much more pro-cyclical than it used to before. It basically happened just before the Trump’s presidency. Moreover, it’s lasted throughout the Biden’s presidency. I referred to this phenomenon in one of the previous posts, where I found this factor among the structural forces driving higher stock prices. You can find out more below.
Perfect Storm For US Stock Market

The US stock market has outperformed its peers over the past years or even decades. Every time we approached a new high, there was some chatter that a bubble was about to burst (whether or not one actually existed). I’m feeling similar vibes these days after the SP500 has rallied 25% since November, in the meantime establishing its new all-time high.
Thus, if the major driver of the higher term premium changed several years ago, and nothing suggests it could return to its previous state, it seems that the term premium might continue climbing in the foreseeable future. What’s more, its higher level would better correspond to high positive correlation between stock and bond returns. Finally, a more volatile rate environment, which I believe to be prevailing in the coming years, is also likely to drive the term premium higher.
Portfolio construction consequences
If we think that both the term premium and stock-bond correlation are likely to stay high/positive, then one would wonder what it can mean for portfolio allocation policy. I decided to visualize the point in the chart below.
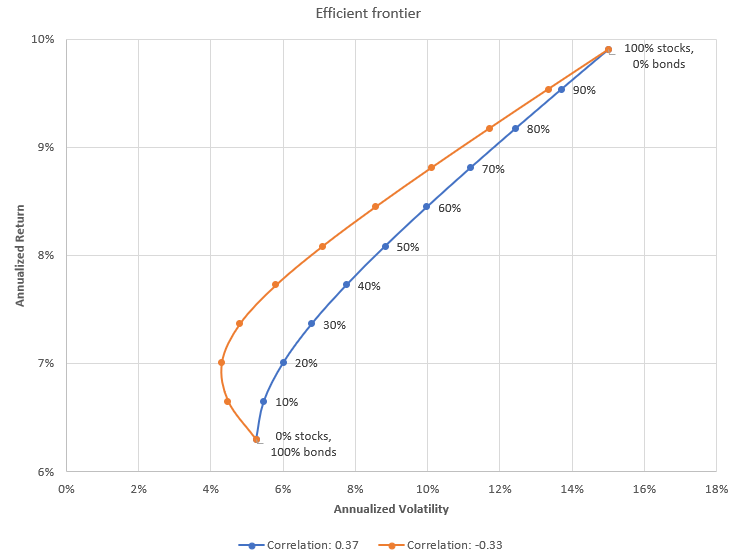
First, I calculated the correlation coefficients between US stock and bond returns for two periods. The first spans between 1977 and mid-2000 (0.37), and the second starts in mid-2000 and lasts until mid-2022 (-0.33). As you can notice, these periods correspond to the two different regimes in terms of the correlation level (look at the first chart in this post). Second, I drew the two efficient frontier curves using the same period for returns for both curves (1977 to mid-2022), and the two different correlation coefficients. What did I obtain?
Unsurprisingly, the higher correlation, the lesser positive effect of bonds in a portfolio. As I wrote before, positive stock-bond correlation makes bonds losing their hedging feature. Therefore, the same return can be obtained at a higher risk level when the correlation is higher/positive. Put it differently, you can earn a higher return at the same level of risk should correlation be negative. The only thing to do is to increase a stock allocation. For instance, at the constant 10% level of risk, and at the -0.33 correlation coefficient, you can earn roughly 8.8%. In turn, if the coefficient rises to 0.37, you can earn 8.4% at the same level of risk.
To sum it up, a risk-averse investor is likely to reduce a stock allocation once correlation turns positive and rising (this investor aims to minimize volatility). At the same time, a risk-seeker might even want to increase a stock allocation in this case, if he or she wants to keep the expected return unchanged. So, the ultimate effect of positive correlation depends on risk aversion (assuming that expected returns and risk are the same).
Did you enjoy the piece? Please share this post and help me reach out to an ever-growing audience.
Would you like to share your opinion on the subject? Don't hesitate to leave a comment.
Though, the latest sell-off saw bond prices soaring and stock prices declining. Thus, one needs to be aware of any change in correlation going forward. This’s especially true if the higher term premium regime is set to end.
https://home.treasury.gov/system/files/221/CombinedChargesforArchivesQ42023.pdf